This article covers the Returns report: the screen that turns every return you have raised into numbers you can act on. It explains what each column means, how Quantity, Value and Credited are worked out, what the turnaround measures count, and which grouping answers which question.
The other articles in this set are Returns (RMAs): setting up and raising a return (opens in a new tab), Returns (RMAs): receiving items back and deciding what happens to them (opens in a new tab), Returns (RMAs): credit notes, refunds and replacement orders (opens in a new tab) and Returns (RMAs): the customer pack, the RMA document and return labels (opens in a new tab). Everything in this report is put there by that work, so an empty column usually means the return has not got that far yet.
1. What the report is, and how to open it
Go to Outbound > Reporting > Returns. An RMA (Return Merchandise Authorisation) is the reference a customer quotes when sending items back, and this is the analysis view over all of them. Three things are worth knowing before you read a number.
- One row per item, not per return. A return listing six items contributes six rows. A row can still cover several of the same product, in which case Quantity says how many.
- It is read only. There is no New button and nothing here can be edited. A row opens a Returned Item page, with the return itself one click away.
- It is live. Figures are read straight from your returns as you look at them: nothing to refresh, no overnight job.
2. The columns
Ten columns are on when you open the screen: RMA Ref (the return the item is on), Customer, Type (Replacement, Refund or Credit), Status (Draft through to Resolved or Cancelled), Item/Lot ID (the barcode the customer quoted), Product, Reason, Quantity, Value and Days to Resolve.
Reason is the most valuable of them, and a return raised with a lazy reason cannot be analysed later. The list it is picked from lives at Outbound > Configuration > Return Reasons, administrators only, and it wants keeping short: a long one gets picked from at random and stops meaning anything.
A small settings control at the right-hand end of the column headings opens a tick list of the sixteen other columns the report holds, and your choices stick, so a layout set up once is the one you get next time.
- SKU (Stock Keeping Unit, the code identifying a sellable product variant) groups more tightly than Product, so use it where one model ships in several builds. Source Order is the sales order the goods went out on, and Dispatched On is when the item originally shipped.
- Dispatched From is the warehouse the item went OUT from; Received Into is the one it came back TO, and Destination Location the exact spot inside it. The two warehouses are routinely different sites, and Received Into shows which of yours is absorbing the returns workload.
- Outcome is what you did with the item once it arrived, and is blank until it has been received and processed. New Item is filled only on a New asset with new barcode outcome: it is the barcode the goods now sit under, while Item/Lot ID stays the one the customer quoted, so tracing a unit needs both.
- The rest are covered where they are used: Authorised Qty, Outstanding Qty, Dispatched Qty and Credited in section 3, Days to Receive in section 4, and the dates those are worked out from, Received On, Resolved On and Created On.
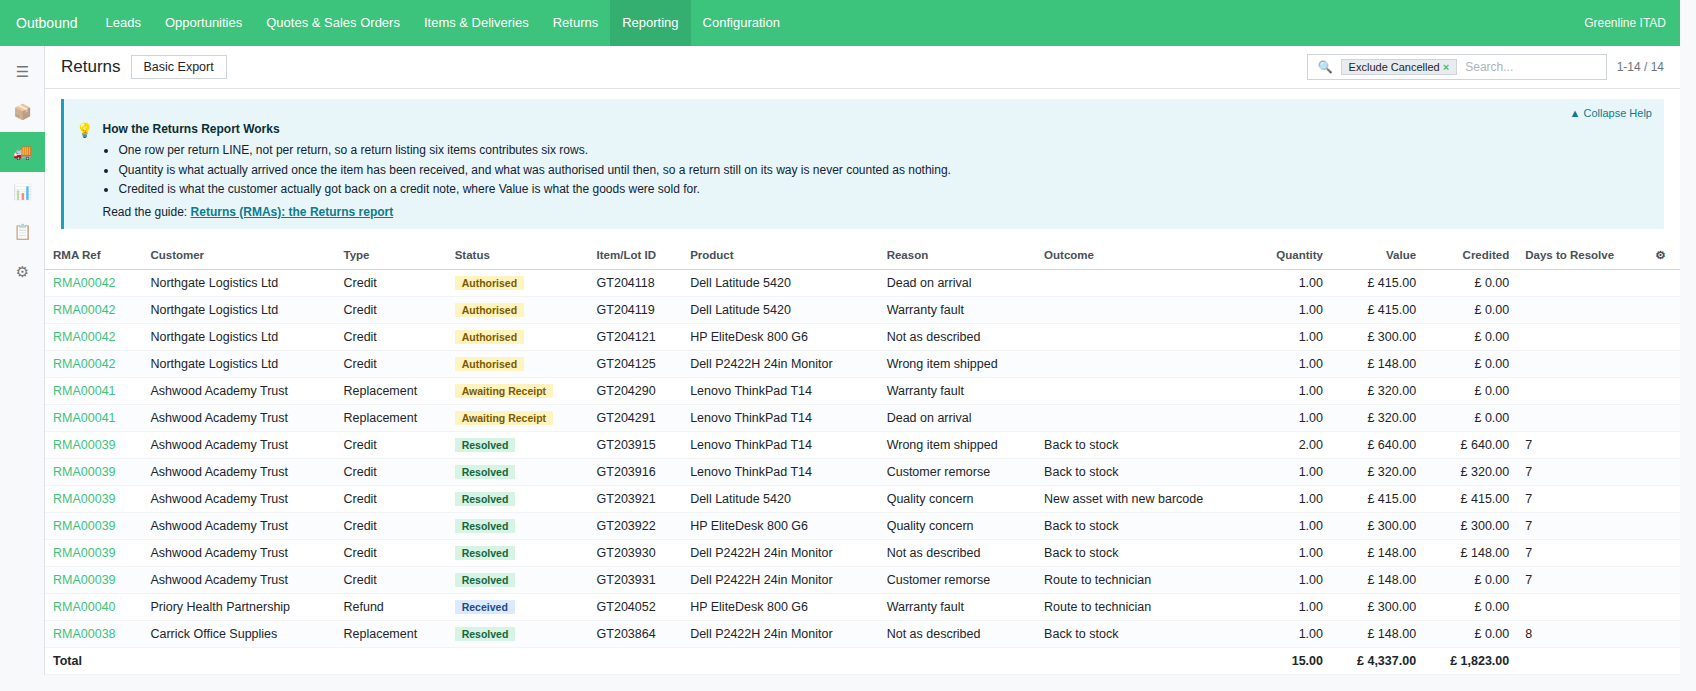
Six columns carry a Total at the foot of the list - Quantity, Authorised Qty, Outstanding Qty, Dispatched Qty, Value and Credited - and each total respects whatever you have filtered to. Neither money total converts between currencies, and there is no Currency column anywhere on this report: not in the list, not in the tick list, not in the search box and not under Group By. So on a system invoicing in more than one currency, those two totals add one to another with nothing on screen to say so. Group by Customer and read a customer at a time, since a customer is normally billed in one currency.
3. How Quantity, Value and Credited are worked out
Quantity is what actually came back once the item has been received, and what was authorised until then. That second half is why everything still in the post does not drop out of your charts. The optional columns split it apart. Authorised Qty is how many were authorised whatever has arrived, Outstanding Qty is authorised less received, and Dispatched Qty is how many went out on the delivery line the item came off - the denominator for "6 of the 40 we sent came back". A zero in Outstanding Qty is a true statement rather than a gap, so unlike the day measures it is never left blank.
Value is the untaxed worth of that quantity, after any discount, taken from the customer invoice that billed the item and pro-rated to how many came back. Ashwood Academy Trust bought five Lenovo ThinkPad T14 at £400 each less 20 per cent, so the invoice line reads £1,600 excluding VAT (Value Added Tax); two come back and Value shows £640.00. It is not quantity times unit price, which would ignore the discount and, where prices are tax-inclusive, include the tax. Where the item has not been invoiced yet, normal for a fast return, it falls back to the sales order price.
Credited is a different number and is meant to be. It is read back off the credit notes actually raised and counts only the goods lines for that item, so it stays the worth of the goods rather than the net of the note: a restocking fee is taken on a line of its own, which lowers what the note pays the customer without changing Credited. A note counts from the moment it is created, draft or posted alike, so one you have not sent yet is already in the figure; only a cancelled note drops out.
Value and Credited differ for reasons that are all perfectly normal: part-crediting, an order billed in instalments, or an item never invoiced in the first place. On a Replacement return Credited is 0.00 throughout, correctly, because fresh goods went out instead of money coming off.
4. Days to Receive and Days to Resolve
Days to Receive counts whole calendar days from the return being authorised to that item arriving; Days to Resolve counts them from the return being raised to it being resolved. They count by calendar date, so a return authorised at 23:00 on the Monday and received at 01:00 on the Tuesday is one day and not nought. Days to Receive fills once some of that item has actually been booked in, and Days to Resolve only while the return's Status is Resolved, so one that was resolved, cancelled and then started again shows nothing until it is resolved a second time. Blank is not the same as zero: an item authorised and received the same day really did take nought days, and shows nought.
Keeping those blanks genuinely blank is why the two day columns in the LIST hold text rather than numbers, and there is one consequence worth knowing: clicking either heading sorts them as text, so 10 lands above 2 and a slowest-first sort is not what it looks like. Rank by turnaround in the pivot instead, with Days to Receive or Days to Resolve as the measure.
In the pivot and the graph both are AVERAGES, never totals, which is the one thing people misread here: a total of "48 days to resolve" across a dozen returns is a number nobody wants. Blanks are skipped rather than counted as zero, so unresolved returns do not drag a month's average down.
5. Searching, filtering and grouping
Typing in the search box searches RMA Ref, Customer, Product, Item/Lot ID and Reason. The ready-made filters are Open (not yet resolved and not cancelled), Resolved, Overdue (past the deadline AND still open, so a return that ran late and was then resolved never appears here, and one with no Deadline never does either), Exclude Cancelled (see the closing section) and Created On (the standard date filter).
Under Group By you get Reason, Type, Status, Customer, Product, SKU, Outcome, Dispatched From, Received Into, Source Order, Created On and Dispatched On, the last two by month. Stack two or three and they nest in the order you click them.
6. The pivot, the graph, and getting the figures out
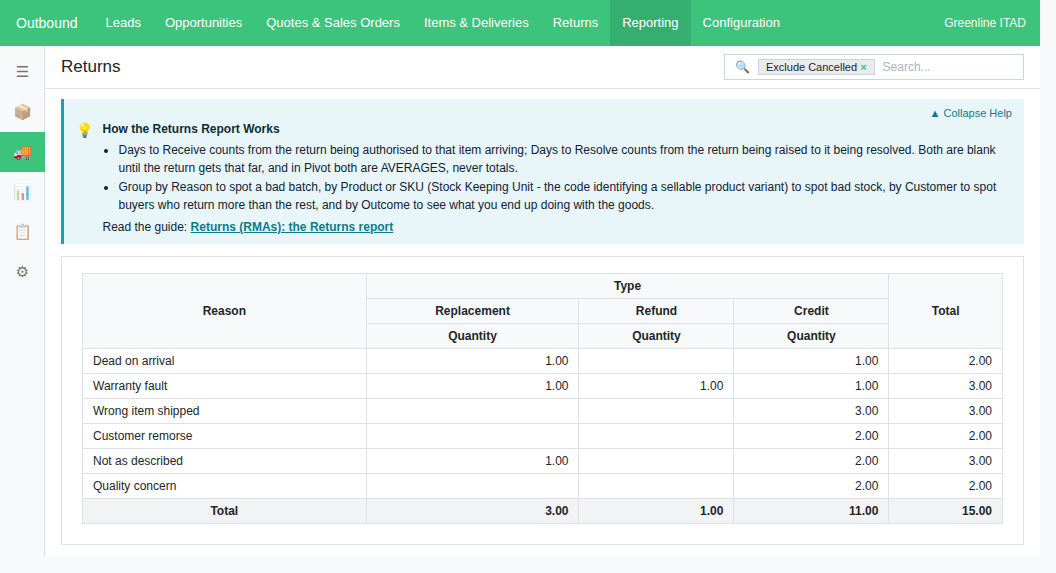
The view switcher at the top right moves between list, pivot and graph, and your filters and groupings carry across. The pivot opens with Reason down the side, Type across the top and Quantity as the measure, so it opens on what people are sending back and what they want done. Click any heading to break it down further, and use the measures control to swap Quantity for Value, Credited, Authorised Qty, Outstanding Qty, Dispatched Qty, Days to Receive or Days to Resolve. The graph draws the same question as a bar chart of Quantity by Reason.
To get the numbers into a spreadsheet, Basic Export at the top of the list writes what is on screen to a CSV (Comma Separated Values) file, the same rows and columns. For a different set of fields, tick one or more rows and choose Advanced Export from the Actions menu.
7. Answering a real question
- Which product comes back most? Group by Product or SKU, read Quantity for volume, then switch the measure to Value: a few expensive returns can outweigh a pile of cheap ones.
- Which customer returns most? Group by Customer, then Reason underneath. Nearly all Customer remorse is a sales conversation; nearly all Dead on arrival is a packing or stock problem, not the customer.
- How long are we taking? Apply Resolved, group by Created On and read Days to Resolve in the pivot. Add Days to Receive to see how much of the wait is the customer posting the goods rather than you processing them.
- Was it a bad batch? Group by Dispatched On rather than Created On, because a bad batch is defined by when it shipped, not by when the returns came in. Add Reason underneath and look for a spike of Dead on arrival or Quality concern.
Common problems
- The count does not match the Returns list. Two reasons, both deliberate. This report has one row per item and the list one per return, so 20 returns can easily be 60 rows; and Exclude Cancelled is on when you open the screen. Click the x on that filter to put cancelled returns back.
- A row shows a Value of 0.00. Either the item was never priced - given away, or discounted to nothing - or there is no invoice and no order line behind it at all, which happens when the return came off a delivery never sold through an order.
- Credited is 0.00 on a Refund or Credit return. Either no credit note has been raised yet, or the item was never invoiced, in which case there was nothing to credit and the goods came off the quantity still to be billed.