The Reports app turns any of your main lists into a named report you can run again, share with colleagues and send to customers. This guide explains what a report is, which reports come ready-made, and how to build your own from a list in a couple of minutes.
1. What a Report Definition is
A Report Definition is a saved recipe for a report: where the data comes from, which rows, which columns and in what order. Nothing is copied when you save one, so a report always shows the data as it is on the day it is used. The recipes are under Reports > Report Definitions. Each file you make from one is kept for a while under Reports > Generated Reports, holding the data as it was at that moment.
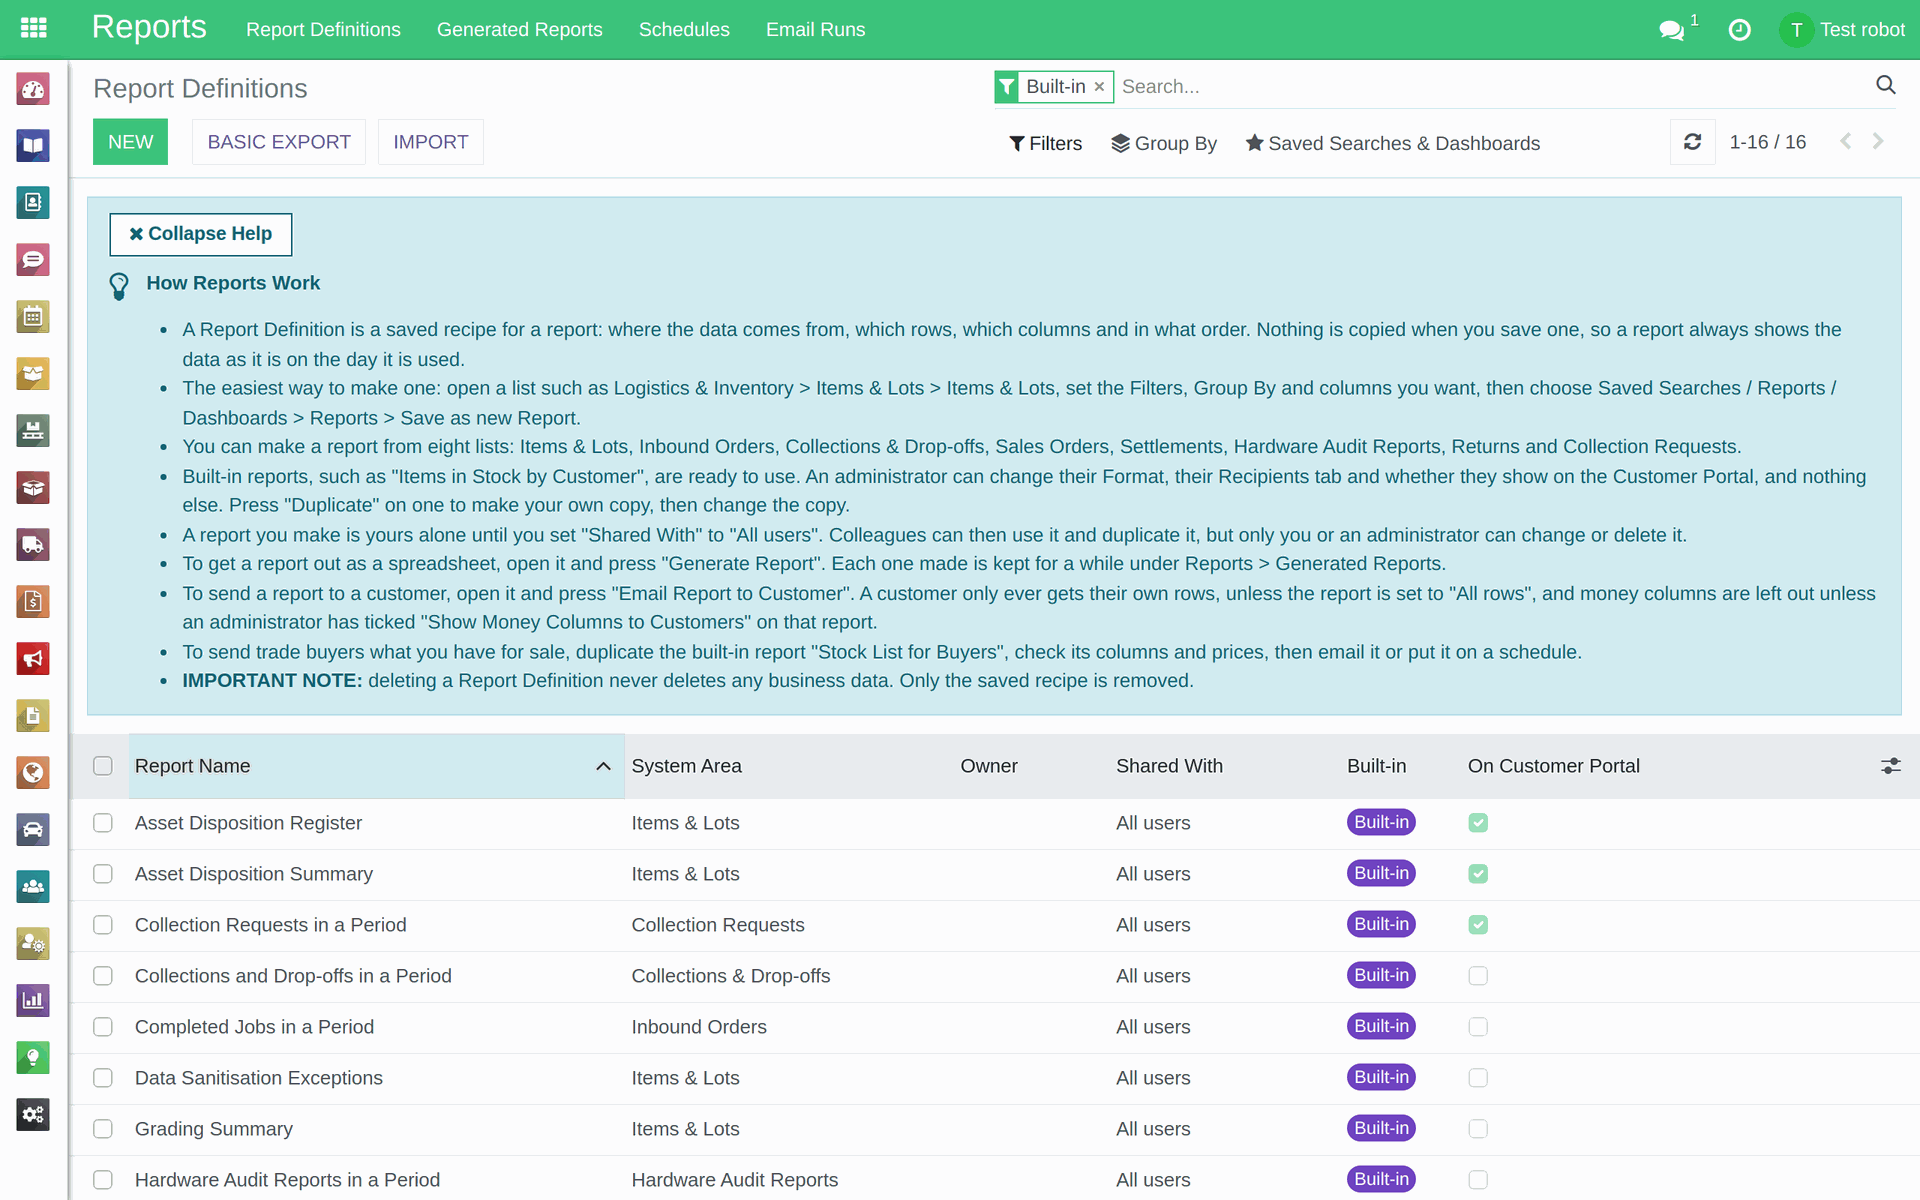
Reports > Report Definitions, filtered to the built-in reports, with its help panel.
2. The built-in reports
RecyclyERP comes with ready-made reports, marked Built-in on the list and with no Owner:
- Items in Stock by Customer: everything received from each customer that is physically in your warehouse now.
- Stock List for Buyers: what you have for sale now, one line per kind of item, with how many and the price.
- Items Received in a Period: items and lots collected or dropped off in the period, by asset type.
- Completed Jobs in a Period: jobs at a completed stage whose first collection or drop-off fell in the period.
- Collections and Drop-offs in a Period: collections and drop-offs scheduled in the period, by customer.
- Sales Orders in a Period: outbound sales orders placed in the period, by customer.
- Settlements in a Period: confirmed settlements dated in the period, by customer, if your system uses Settlements.
- Returns in a Period: customer returns raised in the period, by customer.
- Collection Requests in a Period: collection and drop-off requests for dates in the period, by status.
- Hardware Audit Reports in a Period: processed audit and erasure reports dated in the period, by device type.
- Data Sanitisation Exceptions: received items that may still hold data more than 14 days after they arrived, with no erasure or destruction recorded, or one that failed.
- Processing Backlog: items in your warehouse still being processed, by stage, oldest first.
- Asset Disposition Register: every item received in the period and what has happened to it: grade, data status, certificate, Intended Final Action and whether it is complete.
- Asset Disposition Summary: how many items received in the period went each way, by Intended Final Action and Asset Type.
- Grading Summary: items received in the period, by job, in grade order, with the test results behind each grade and what was paid for them.
- Items in Stock, Oldest First: what you have for sale, longest in stock first, with its price and what it cost.
A built-in report cannot be changed, apart from three things an administrator can set: its Format, its Recipients tab and whether it shows on the Customer Portal. To make one your own, open it and press Duplicate. The copy is named "Copy of" and the report's name, belongs to you, and can be changed however you like.
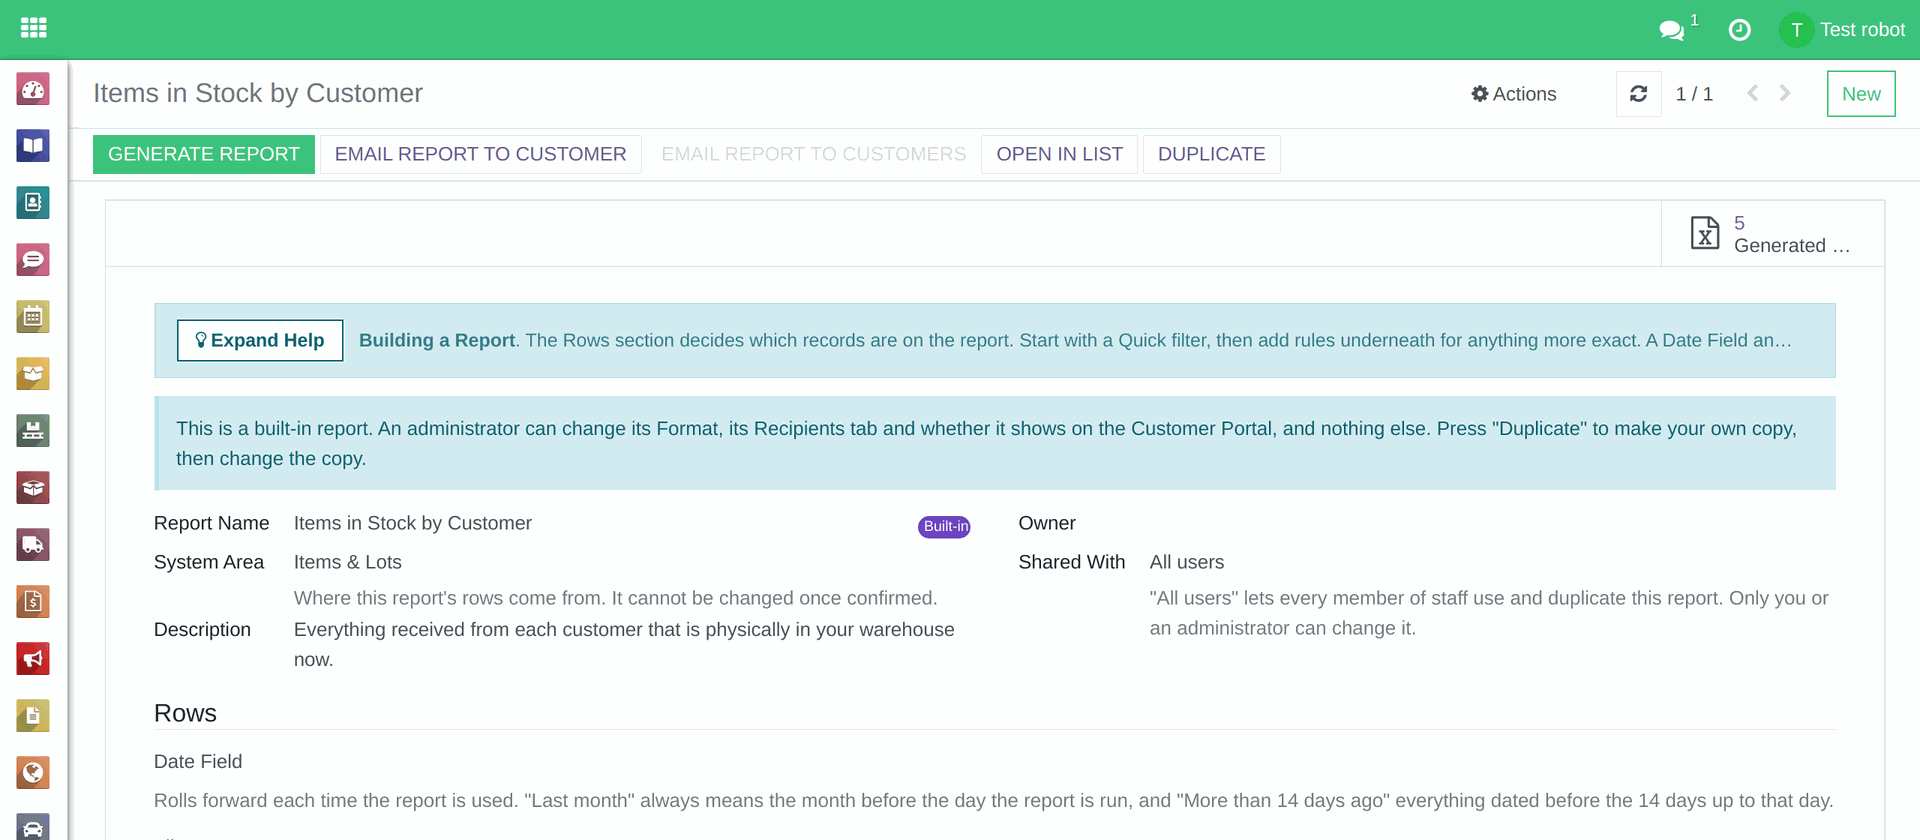
A built-in report, with Duplicate at the top and the note that explains it.
3. Making a report from a list
You can make a report from eight lists: Items & Lots, Inbound Orders, Collections & Drop-offs, Sales Orders, Settlements, Hardware Audit Reports, Returns and Collection Requests. Open the list and set its Filters, Group By and columns until it shows what you want, then choose Saved Searches / Reports / Dashboards > Reports > Save as new Report. The pop-up shows What will be saved and the Columns showing on the list now: untick any you do not want, check the Report Name and press Save Report.
For example, for one customer's stock: open Logistics & Inventory > Items & Lots > Items & Lots, search for the customer and choose the filter In Warehouse, group by Asset Type, then choose Save as new Report. The new report opens in the Reports app, ready to generate, email or schedule.
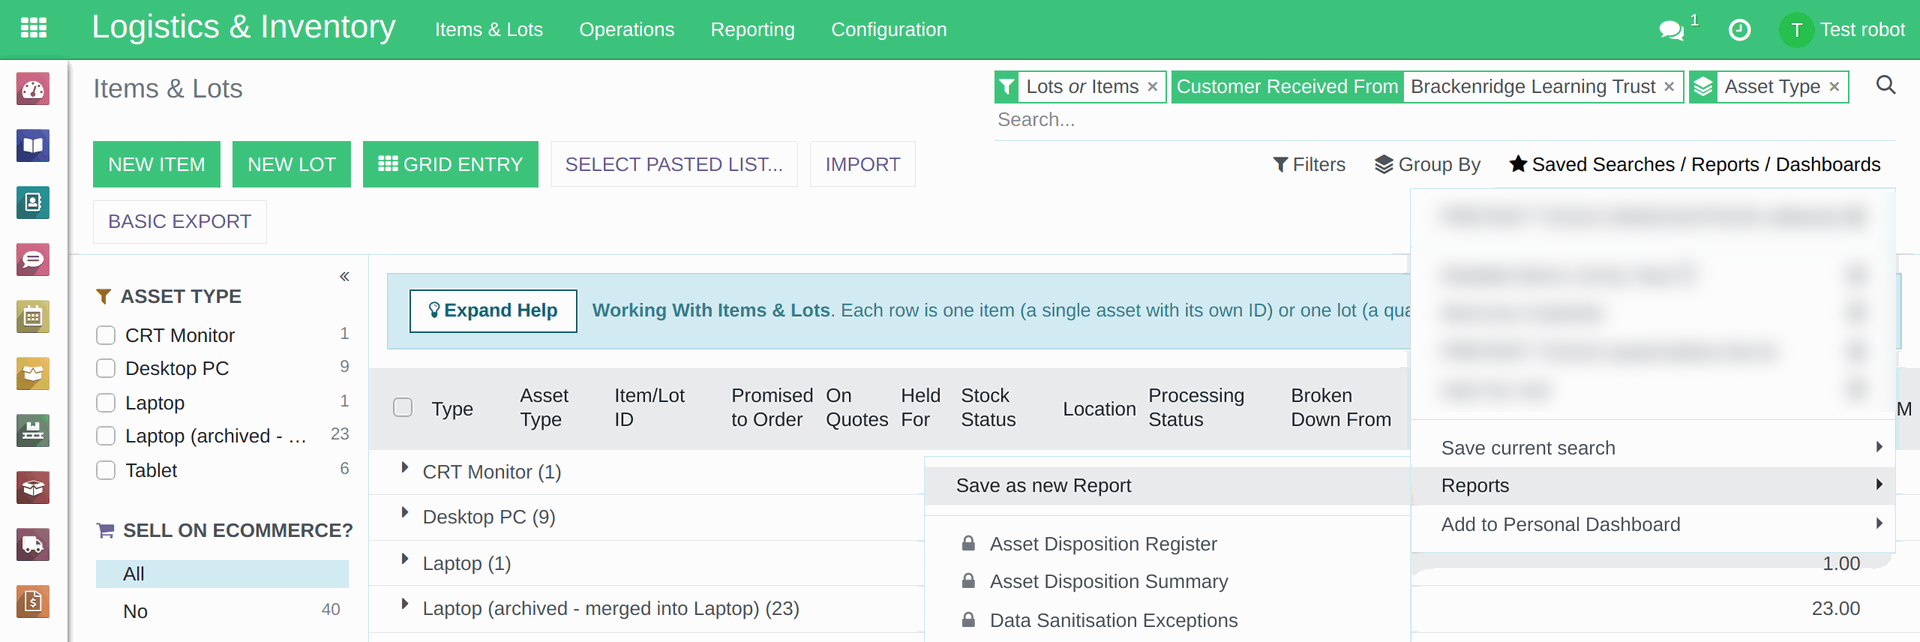
Items & Lots searched to one customer and grouped by Asset Type, with Saved Searches / Reports / Dashboards > Reports open and Save as new Report at the top.
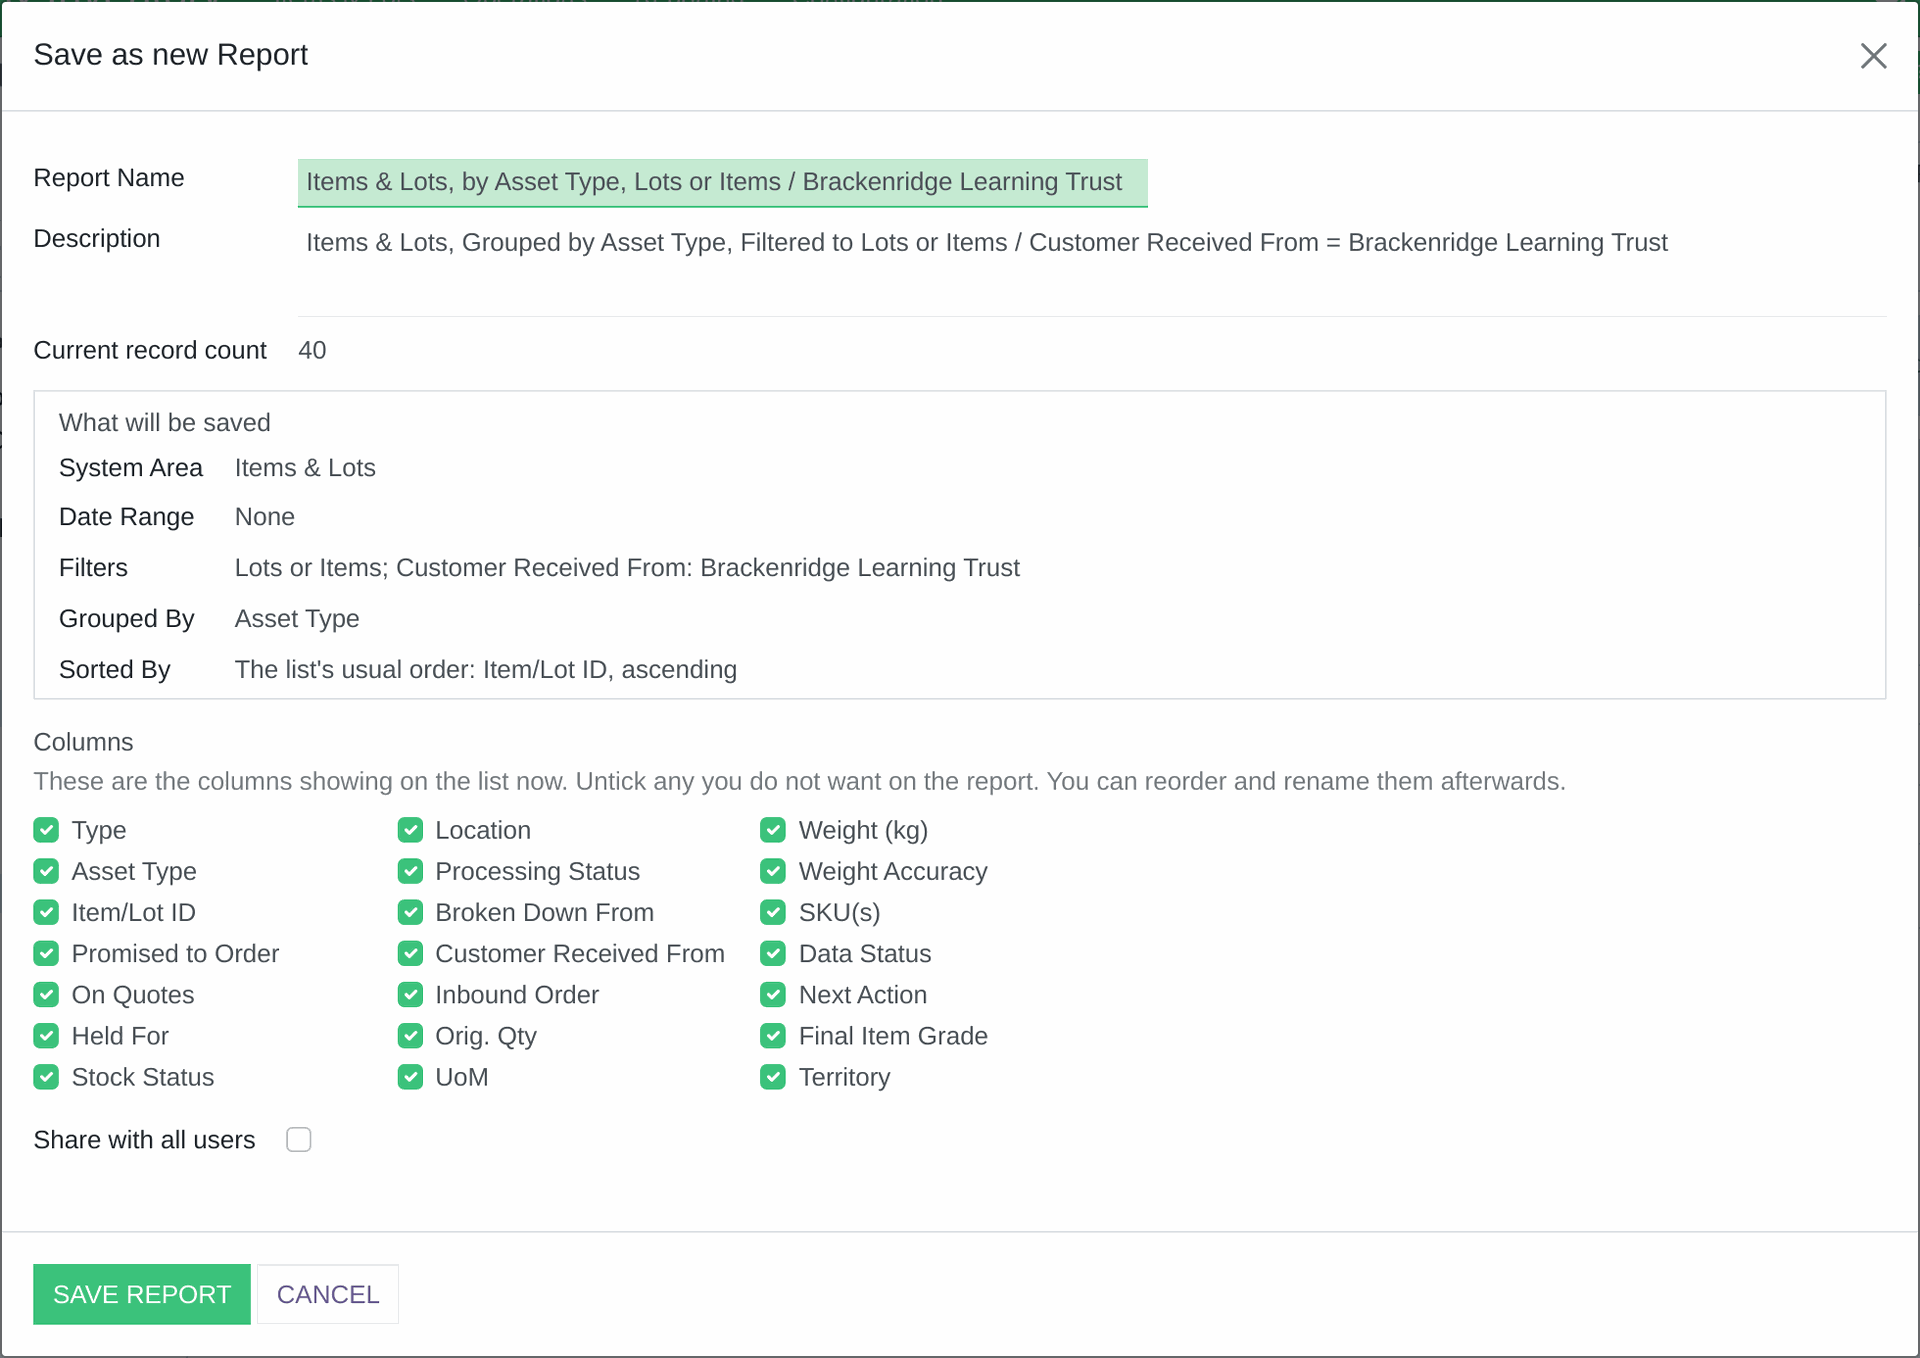
The Save as new Report pop-up, showing what will be saved and the columns.
4. Rows: which records are on the report
The Rows section decides which records are on the report. Start with a button under Quick filters, which adds a ready-made rule, then add rules underneath for anything more exact. A Date Field and Period make the report roll forward: "Last month" run on 3 December covers 1 to 30 November; run on 3 January it covers December. "More than 14 days ago" run on 20 November covers everything dated 5 November or earlier.
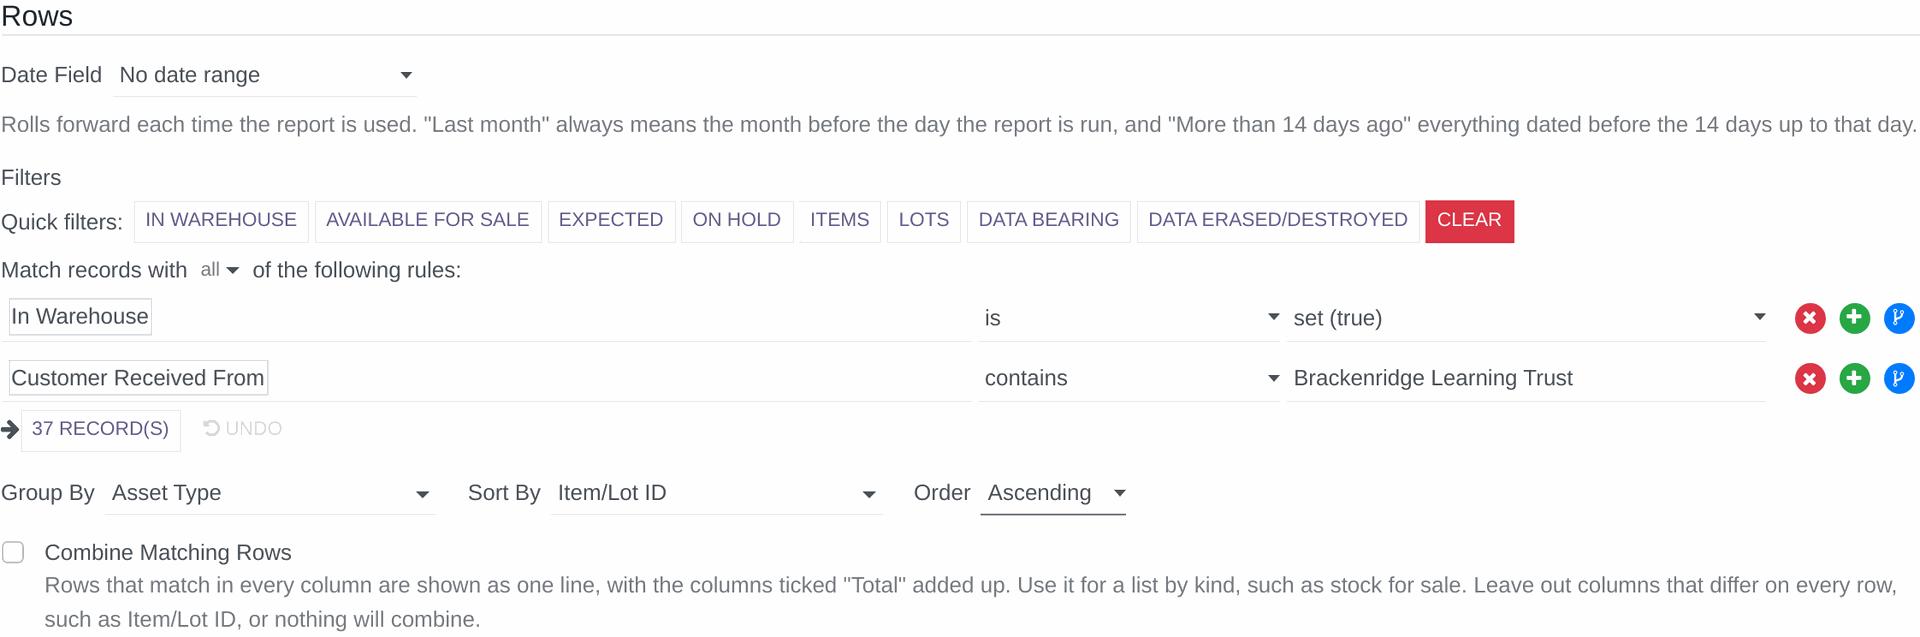
The Rows section of a report, with its Quick filters and rules.
5. The Columns tab
The Columns tab decides what each row shows. Drag a row by its handle to change the order, and change Heading on Report to rename a column on the report only, for example "Final Item Grade" as "Grade": the list screen keeps its own name. Tick Total on a column to add it up on the report.
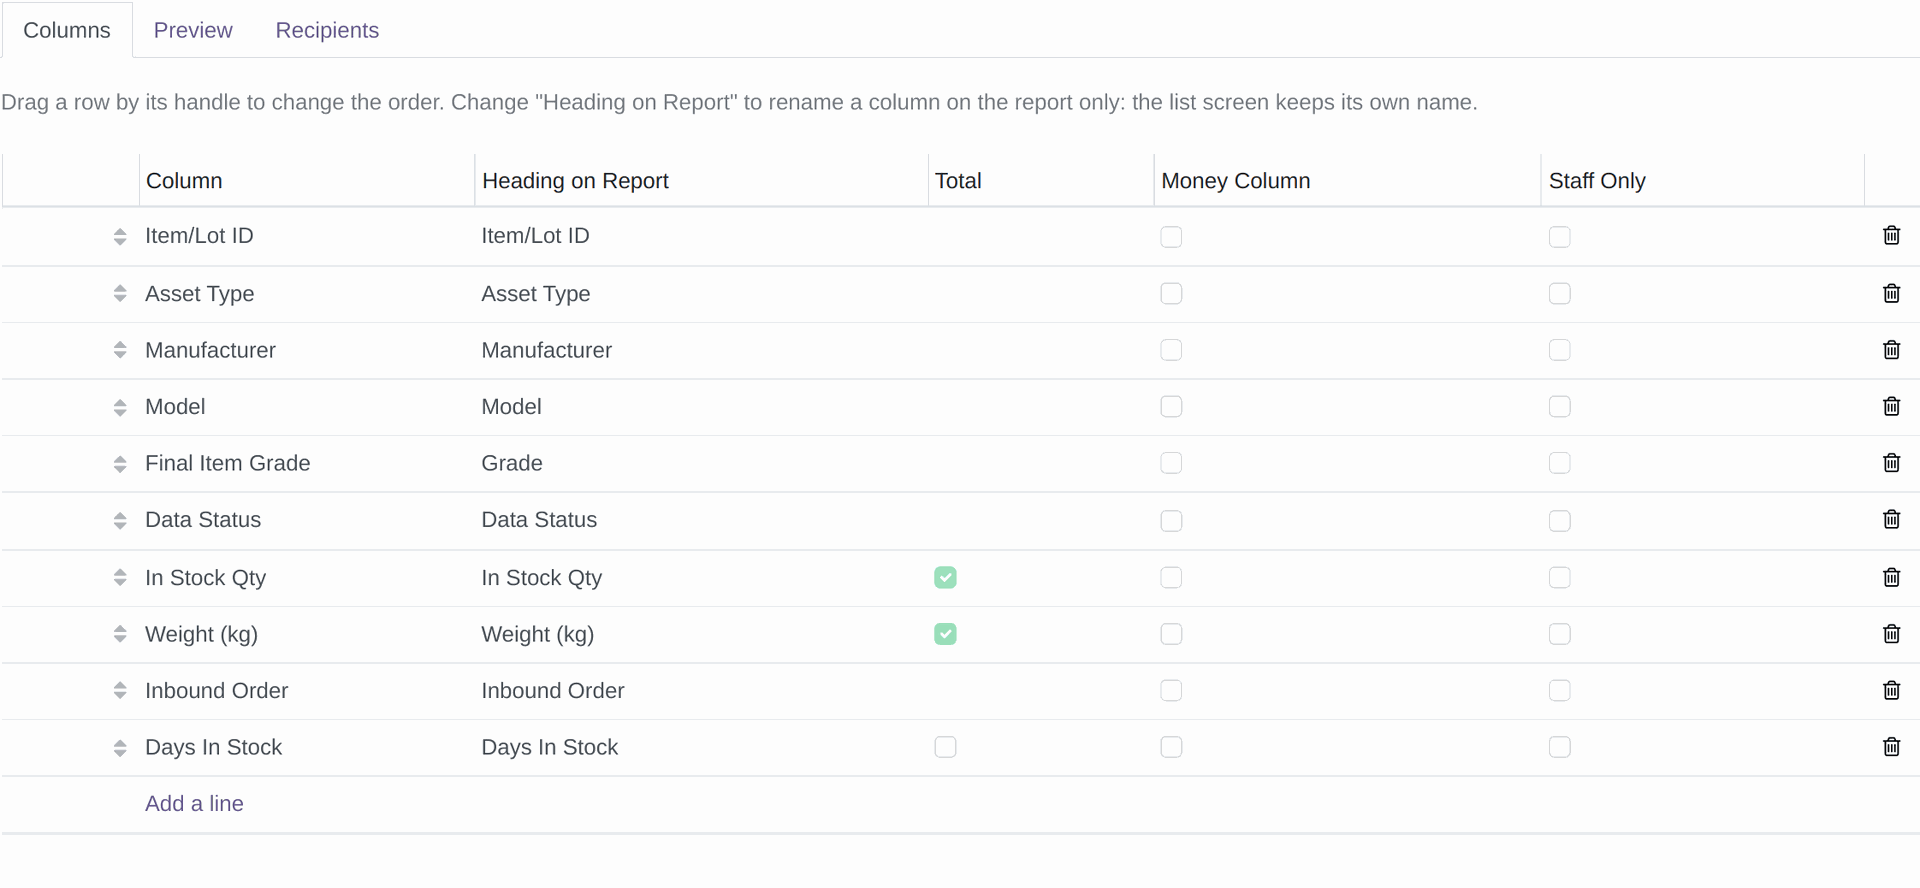
The Columns tab, with Final Item Grade renamed to Grade.
6. The Preview tab
The Preview tab shows the report exactly as it will come out, so check it before anyone else sees it. The line above it gives the number of rows, for example "Showing all 37 rows, exactly as they will appear on the report." Choose a customer under Preview For to see one customer's copy, and press Refresh Preview after a change.
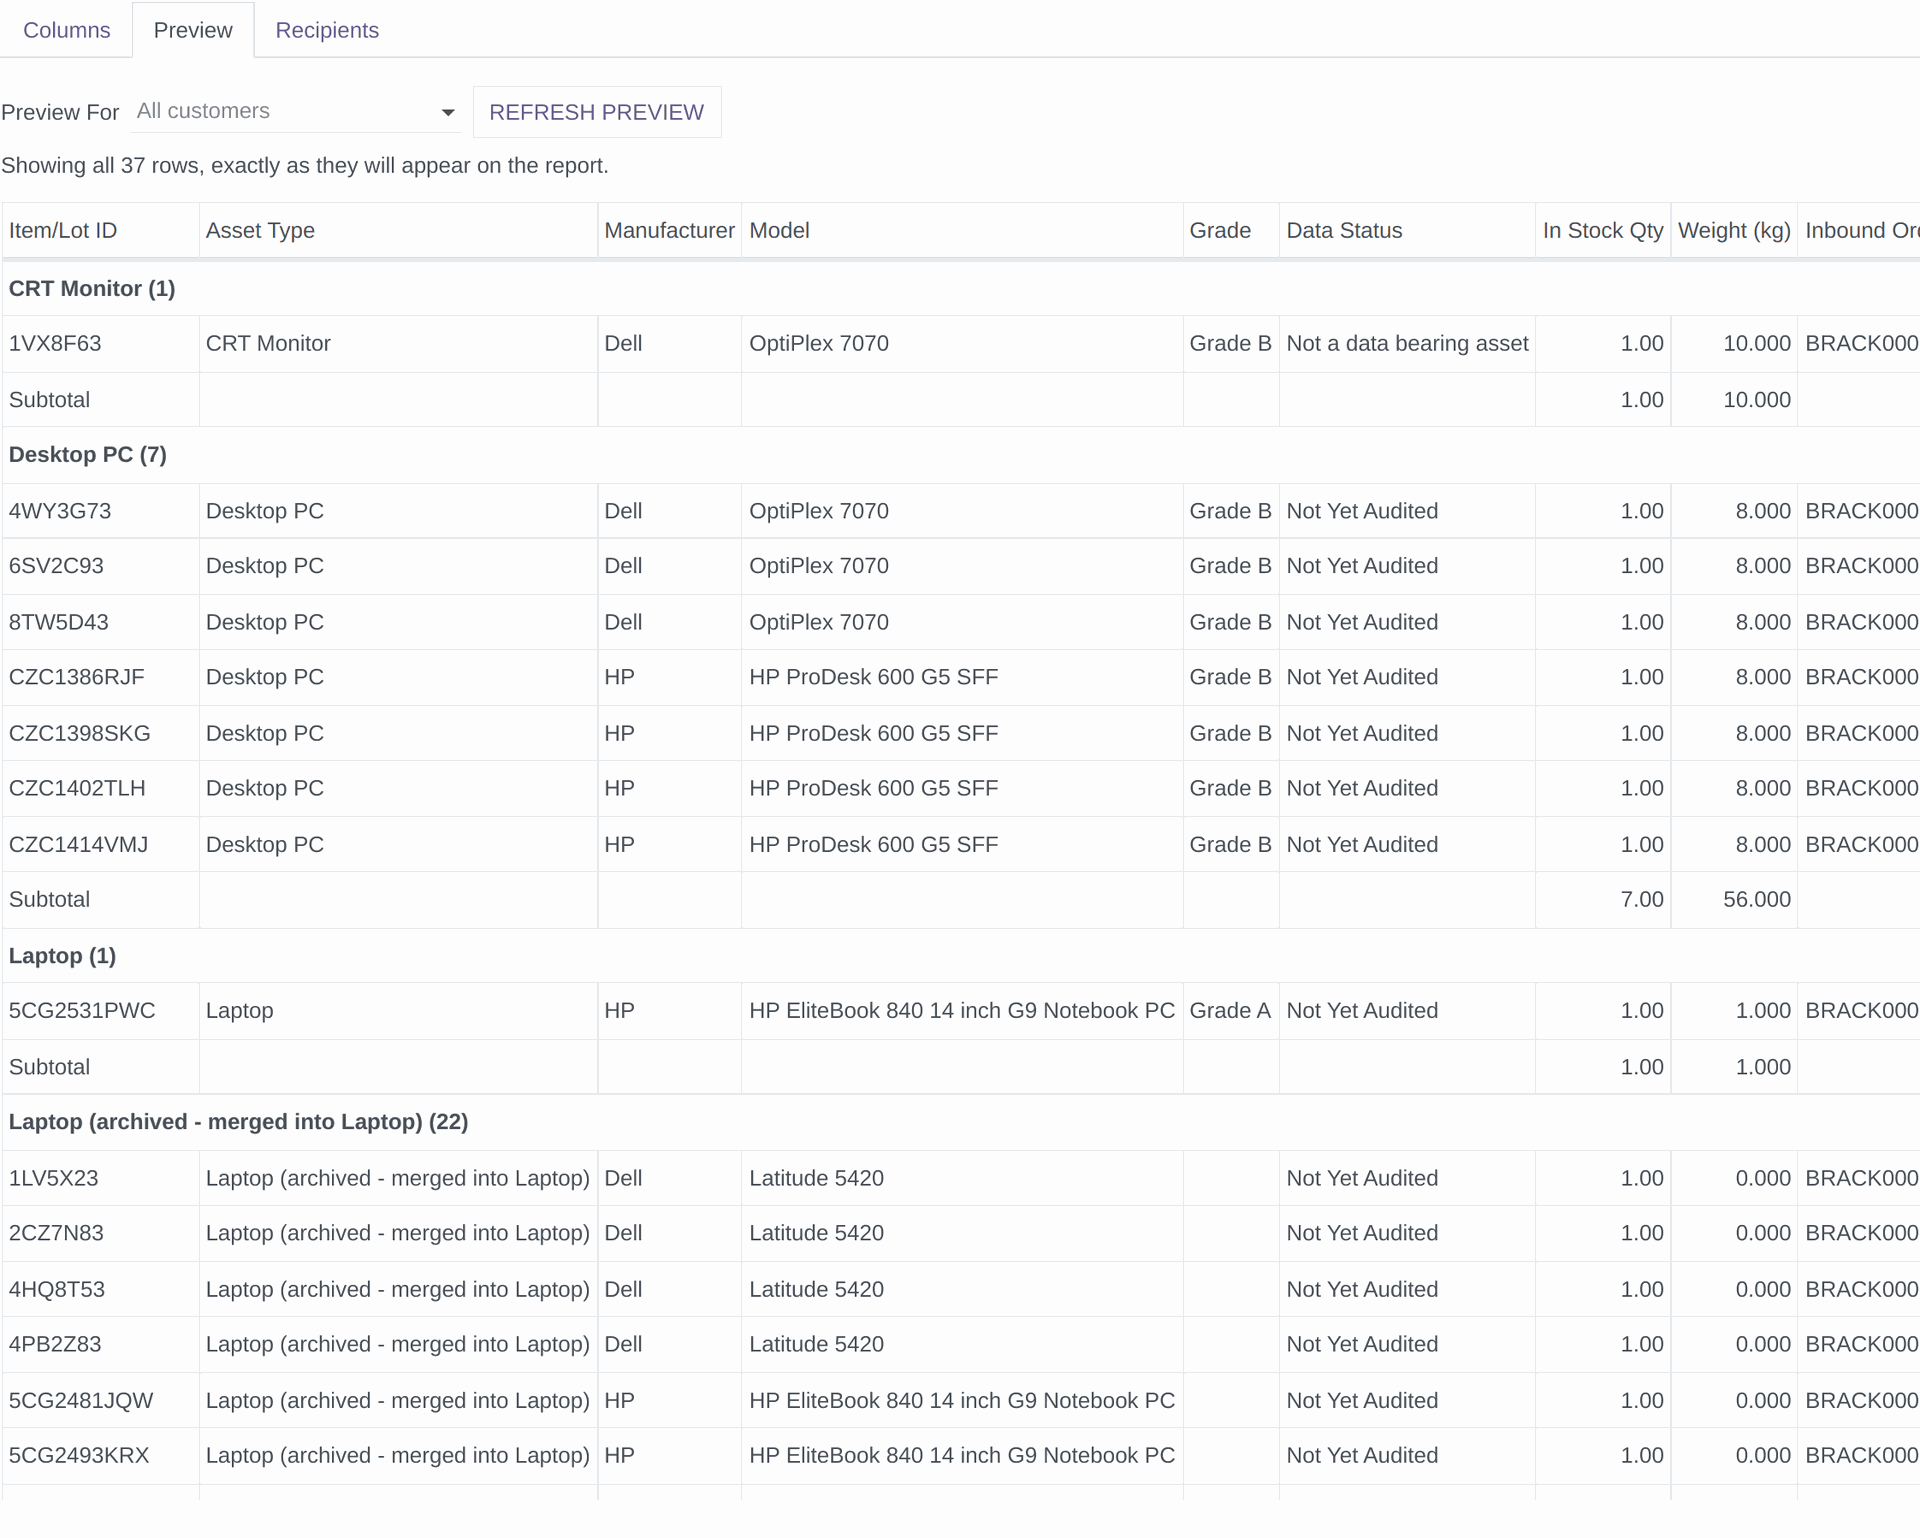
The Preview tab and its row count.
7. Sharing a report
A report you make is yours alone until you set Shared With to All users. Colleagues can then use it and duplicate it, but only you or an administrator can change or delete it. Only an administrator can change who a report's Owner is.
8. Combine Matching Rows
Tick Combine Matching Rows for a list by kind, such as stock for sale. Rows that match in every column are shown as one line, with the columns ticked Total added up. Leave out columns that differ on every row, such as Item/Lot ID, or nothing will combine. The guide Reports: sending trade buyers a list of your stock (opens in a new tab) shows it at work.
9. Things people get wrong
- A report shows live data. If a filter is too wide, the report will be too, so check the record count under the filters.
- Deleting a Report Definition never deletes any business data. Only the saved recipe is removed.
- Making, downloading and emailing a report need the "Access to export feature" right. If you cannot see Generate Report, ask your administrator.
Read more:
- Reports: generating a spreadsheet or PDF (opens in a new tab)
- Reports: emailing a report to one customer or many (opens in a new tab)
- Reports: schedules that send a report by themselves (opens in a new tab)
- Reports: sharing reports on the Customer Portal (opens in a new tab)
- Reports: sending trade buyers a list of your stock (opens in a new tab)